
Why the mechanism exists
A traditional futures contract has a delivery date. As that date approaches, the contract price and the spot price have to converge, because on the day they settle against each other. Convergence is enforced by the calendar.
A perpetual contract has no delivery date. Nothing structural stops its price drifting away from the underlying market and staying there. Funding is the replacement: a recurring payment between the two sides of the market, sized and signed so that whichever side is pushing the contract away from spot pays the other side for the privilege.
It is a price-anchoring mechanism, in other words, and the fact that it also functions as a cost to you is a side effect of that job rather than its purpose. Understanding this makes the rest of the behaviour predictable: funding is high when the contract is far from spot, near zero when it is close, and it flips sign the moment the imbalance flips.
Who pays whom
- Positive rate: the contract is trading above spot, which means longs are the crowded side. Longs pay shorts.
- Negative rate: the contract is trading below spot, shorts are crowded. Shorts pay longs.
The exchange is a router here, not a counterparty. It debits one side and credits the other and does not take a cut of the transfer itself. This is worth being precise about, because "the exchange charges funding" is a common and wrong description, and it leads people to expect that it can be negotiated, refunded or waived. It cannot: the money went to another trader.
Reading a live funding table
Every derivatives venue publishes its current rates. It is worth actually looking at one, because the spread between instruments is far wider than most people assume.
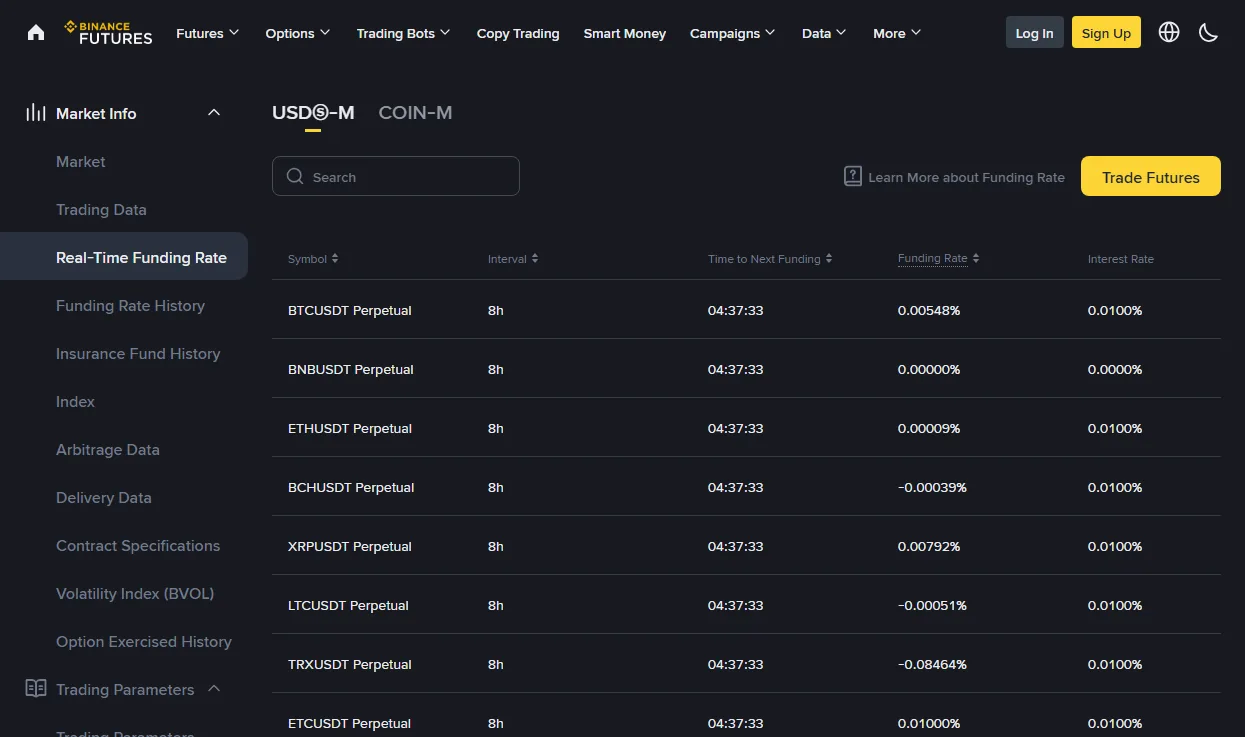
Three things to take from a table like this. First, the interval is stated per contract, and it is not always the same across a venue or across time — a contract can be moved to a shorter interval during volatile periods, which doubles or triples the number of payments per day without the rate itself changing. Second, the countdown tells you whether you are about to be charged, which is the single most useful number on the page if you are considering opening or closing in the next few minutes. Third, the sign is not a property of the market as a whole: on the same day, in the same table, some contracts are positive and others negative.
How it becomes your cost
Funding is calculated on the notional value of your position, not on your margin. This is the part that surprises people at high leverage.
Take a position worth 10,000 in contract terms, opened with 500 of margin at twenty times leverage. A funding rate of 0.01% costs 1 unit at settlement. Against the position that is a rounding error. Against the 500 you actually committed, it is 0.2% — and if the rate holds at that level through three settlements a day, it is 0.6% of your capital per day, or a little over 4% a week, in a market that has not moved at all.
That is the honest way to think about funding: convert it to a percentage of your money, not of the position, and then annualise it if you intend to hold. A rate that reads as trivial in the table is frequently the largest single cost of a leveraged position held for more than a couple of days.
Settlement, and what actually gets deducted
Only at the settlement instant
Funding is not accrued continuously. It is charged in discrete events at fixed times. If you hold a position for seven hours and fifty-nine minutes across no settlement time, you pay nothing. If you open two minutes before settlement and close two minutes after, you pay the full amount as though you had held all interval.
This produces a real and slightly absurd behaviour around the clock: liquidity thins just before settlement on contracts with a large rate, because traders on the paying side are closing to avoid it and will reopen afterwards. It is worth knowing that this happens, and worth not building a strategy on it — the spread you cross twice to dodge a payment is usually larger than the payment.
What gets deducted from
The payment comes out of your margin balance, not out of a separate fee account. That is the mechanism by which funding moves your liquidation price: less margin against the same position means the maintenance line is closer than it was. A position that was comfortable at entry can be uncomfortable two days later with no price movement whatsoever, and the liquidation estimator is worth re-running rather than trusting the figure you noted when you opened.
How the amount is computed
The exact formula is published by each venue and they differ in detail, but the shape is common to all of them and worth knowing.
- A premium component. How far the contract price sits from the underlying index, averaged over the interval rather than sampled at a moment. This is the part that carries the actual signal.
- An interest-rate component. A small fixed term reflecting the difference in borrowing cost between the two currencies in the pair. On the capture above this is the right-hand column, and on most rows it is a constant.
- A clamp. The result is capped at a maximum in both directions, which is why the rate does not run away during a violent move even though the premium briefly might.
Your payment is then that rate multiplied by your position's notional value. There is no tier, no discount and no VIP interaction — funding is the same for every account holding the same size.
Where it shows up in your account
In three places, and they tell you different things:
- The position row, which usually shows the next expected payment and the countdown. Forward-looking and an estimate.
- The transaction or funding history, which lists what was actually debited and credited. This is the record to use when reconciling, because it is the only one that is fact rather than projection.
- Your realised profit and loss, where funding is folded in and therefore invisible as a line item. This is why people conclude their broker's numbers are wrong: the trade closed roughly where they expected and the account balance did not match, because several funding payments happened in between.
If a position's result does not reconcile, export the funding history first. It explains the discrepancy more often than fees do.
What it tells you, and what it does not
It does tell you which side of the market is crowded right now, and how strongly. A persistently high positive rate means leveraged longs are paying to stay long, which is a real fact about positioning.
It does not tell you where the price is going. A crowded long side sometimes precedes a squeeze and sometimes precedes more upside, and the rate itself does not distinguish between them. People treat extreme funding as a contrarian trigger; it is at best one input, and it is one that stays extreme for far longer than a leveraged position can survive being early.
It also does not tell you about spot demand. Funding is a fact about the derivatives market only. A contract can trade far above spot while spot volume is flat, and that gap is the thing being measured.
Things to be careful about
Collecting funding is not risk-free arbitrage
The standard construction — hold spot, short the perpetual, collect funding while the two legs cancel — is a real strategy and it is not free. It carries basis risk while both legs are open, it requires margin on the short leg that can be called during a rally, the rate can flip to negative and start costing you instead, and the whole thing depends on a single venue remaining solvent and withdrawable. The return looks like a fixed yield and behaves like a leveraged position with a hidden tail.
The rate can move sharply
Funding responds to the market, so it is highest exactly when everything else is also going wrong. Sizing a position on the assumption that today's rate persists is the same error as sizing it on the assumption that today's volatility persists.
Pairs differ enormously
As the capture above shows, two contracts on the same venue on the same afternoon can differ by more than an order of magnitude and point in opposite directions. Smaller and more speculative contracts routinely carry rates that would be extraordinary on a major pair. Check the specific contract; do not generalise from the one you usually trade.
The interval is not a constant
Most contracts settle every eight hours. Some settle more often, and a venue can change the interval for a contract in response to sustained imbalance. Three payments a day at a given rate and six payments a day at the same rate are very different costs, and the interval is on the same page as the rate.
Questions people ask afterwards
Does funding apply to spot trading?
No. It exists only on perpetual contracts. If you hold the asset itself, there is no funding to pay or receive. Margin borrowing has its own interest charge, which is a different mechanism with a different formula.
Is a negative funding rate free money for longs?
It is a credit to longs, which is not the same thing. A negative rate means the market is leaning short, and the position that collects the payment is exposed to the direction that pressure implies. The payment is real; describing it as free requires ignoring the position it is attached to.
How do I find the historical rate for a contract?
The same section of the venue that publishes the live rate normally publishes the history. If you intend to hold for weeks, the history matters more than the current figure — it tells you what the position has actually cost people over time rather than what it costs in this instant.